


Views: 0 Author: Site Editor Publish Time: 2026-08-19 Origin: Site


For operators managing a Seawater Desalination Plant, membrane degradation isn't just a technical issue—it directly impacts energy consumption, operational expenditures, and water compliance. You face constant pressure to maximize output while keeping operational costs low. Knowing when to perform routine Clean-In-Place (CIP) maintenance versus when to execute a complete membrane replacement is crucial. They are entirely distinct processes. CIP targets reversible fouling. Replacement addresses permanent degradation. Relying on calendar dates for these decisions is insufficient. Industrial facilities demand a highly proactive approach. Data-driven performance metrics are the only reliable triggers for maintenance or replacement in heavy-duty commercial applications. We will explore how you can leverage hard metrics to protect your assets. You will learn the specific indicators that signal the immediate need for cleaning. We will also define the threshold where replacement becomes the only viable financial option for your facility.
Cleaning frequency: Typically required every 3 to 6 months, triggered strictly by a 10–15% deviation in baseline performance (pressure, flow, or salt passage).
Replacement lifespan: SWRO membranes generally last 3 to 5 years, depending heavily on feedwater quality and pretreatment efficacy.
The tipping point: Replacement becomes economically necessary when the increased energy costs to push water through fouled membranes exceed the annualized capital cost of new elements.
Pretreatment matters: Effective removal of suspended solids and biological matter is the single biggest factor in extending membrane life.
Every plant manager wrestles with a delicate financial balance. You must constantly weigh capital expenditures against operational expenditures. Buying new membranes requires a massive CapEx approval. However, pushing water through heavily fouled membranes drains your OpEx budget silently. High-pressure pumps must work harder to overcome resistance. Electricity consumption spikes dramatically as a result. Chemical cleaning costs escalate. Plant downtime disrupts production schedules. You cannot afford to guess when to intervene in this high-stakes environment.
Delaying routine CIP maintenance creates severe consequences for your facility. Reversible fouling quickly hardens into irreversible scaling. Biological growth secretes protective biofilms across the polymer surface. These biofilms block membrane pores permanently. Waiting too long permanently shortens membrane life. This negligence forces premature replacement. You essentially waste the initial investment. Regular cleaning protects the underlying polyamide layer from irreversible physical stress. A disciplined approach ensures you extract maximum value from every element.
We must clearly define what successful maintenance looks like. A winning strategy maintains stable permeate quality continuously. At the same time, it keeps specific energy consumption (kWh/m³) close to the original design baseline. You ensure efficient operation by tracking these specific variables daily. Operators should aim to extend the operational window between cleanings without sacrificing permeate flow. Balancing these factors guarantees long-term profitability and sustainable plant operation.
Data reveals exactly when your membranes need attention. Industry standards rely on a specific formula known as the 15% rule. You must trigger a CIP protocol when any key metric deviates significantly from the startup baseline. Monitoring these triggers prevents catastrophic fouling.
Normalized Permeate Flow: Drop of 10–15% from the initial baseline.
Normalized Salt Passage: Increase of 5–10% (indicating potential scaling or minor chemical degradation).
Normalized Differential Pressure (dP): Increase of 15% across a single stage.
You cannot rely on raw data alone. Raw metrics can be highly deceptive in industrial settings. Seasonal temperature changes naturally alter water viscosity. Feedwater salinity fluctuations impact osmotic pressure directly. You must use normalized data to make accurate decisions. Normalization software removes these environmental variables through complex algorithms. It reveals the true health of your membrane elements. Using raw data often leads to unnecessary cleanings or delayed interventions.
A blind cleaning approach rarely works effectively. You must tailor your chemicals to the specific foulant present in the system. Conduct a membrane autopsy or analyze system data first. Use low pH solutions to dissolve inorganic scaling like calcium carbonate. Deploy high pH solutions to remove organic and biological fouling. Target the exact problem to restore performance efficiently. Mixing incorrect chemicals can permanently damage the membrane surface.
Foulant Type | Primary Indicator | Recommended CIP Strategy |
|---|---|---|
Inorganic Scaling (Calcium/Silica) | Last-stage dP increase | Low pH cleaning (e.g., Citric Acid, pH 2.0) |
Organic & Particulate Fouling | First-stage dP increase | High pH cleaning (e.g., NaOH, pH 11.0 - 12.0) |
Biological Fouling | Overall dP increase, flow drop | High pH cleaning combined with approved biocides |
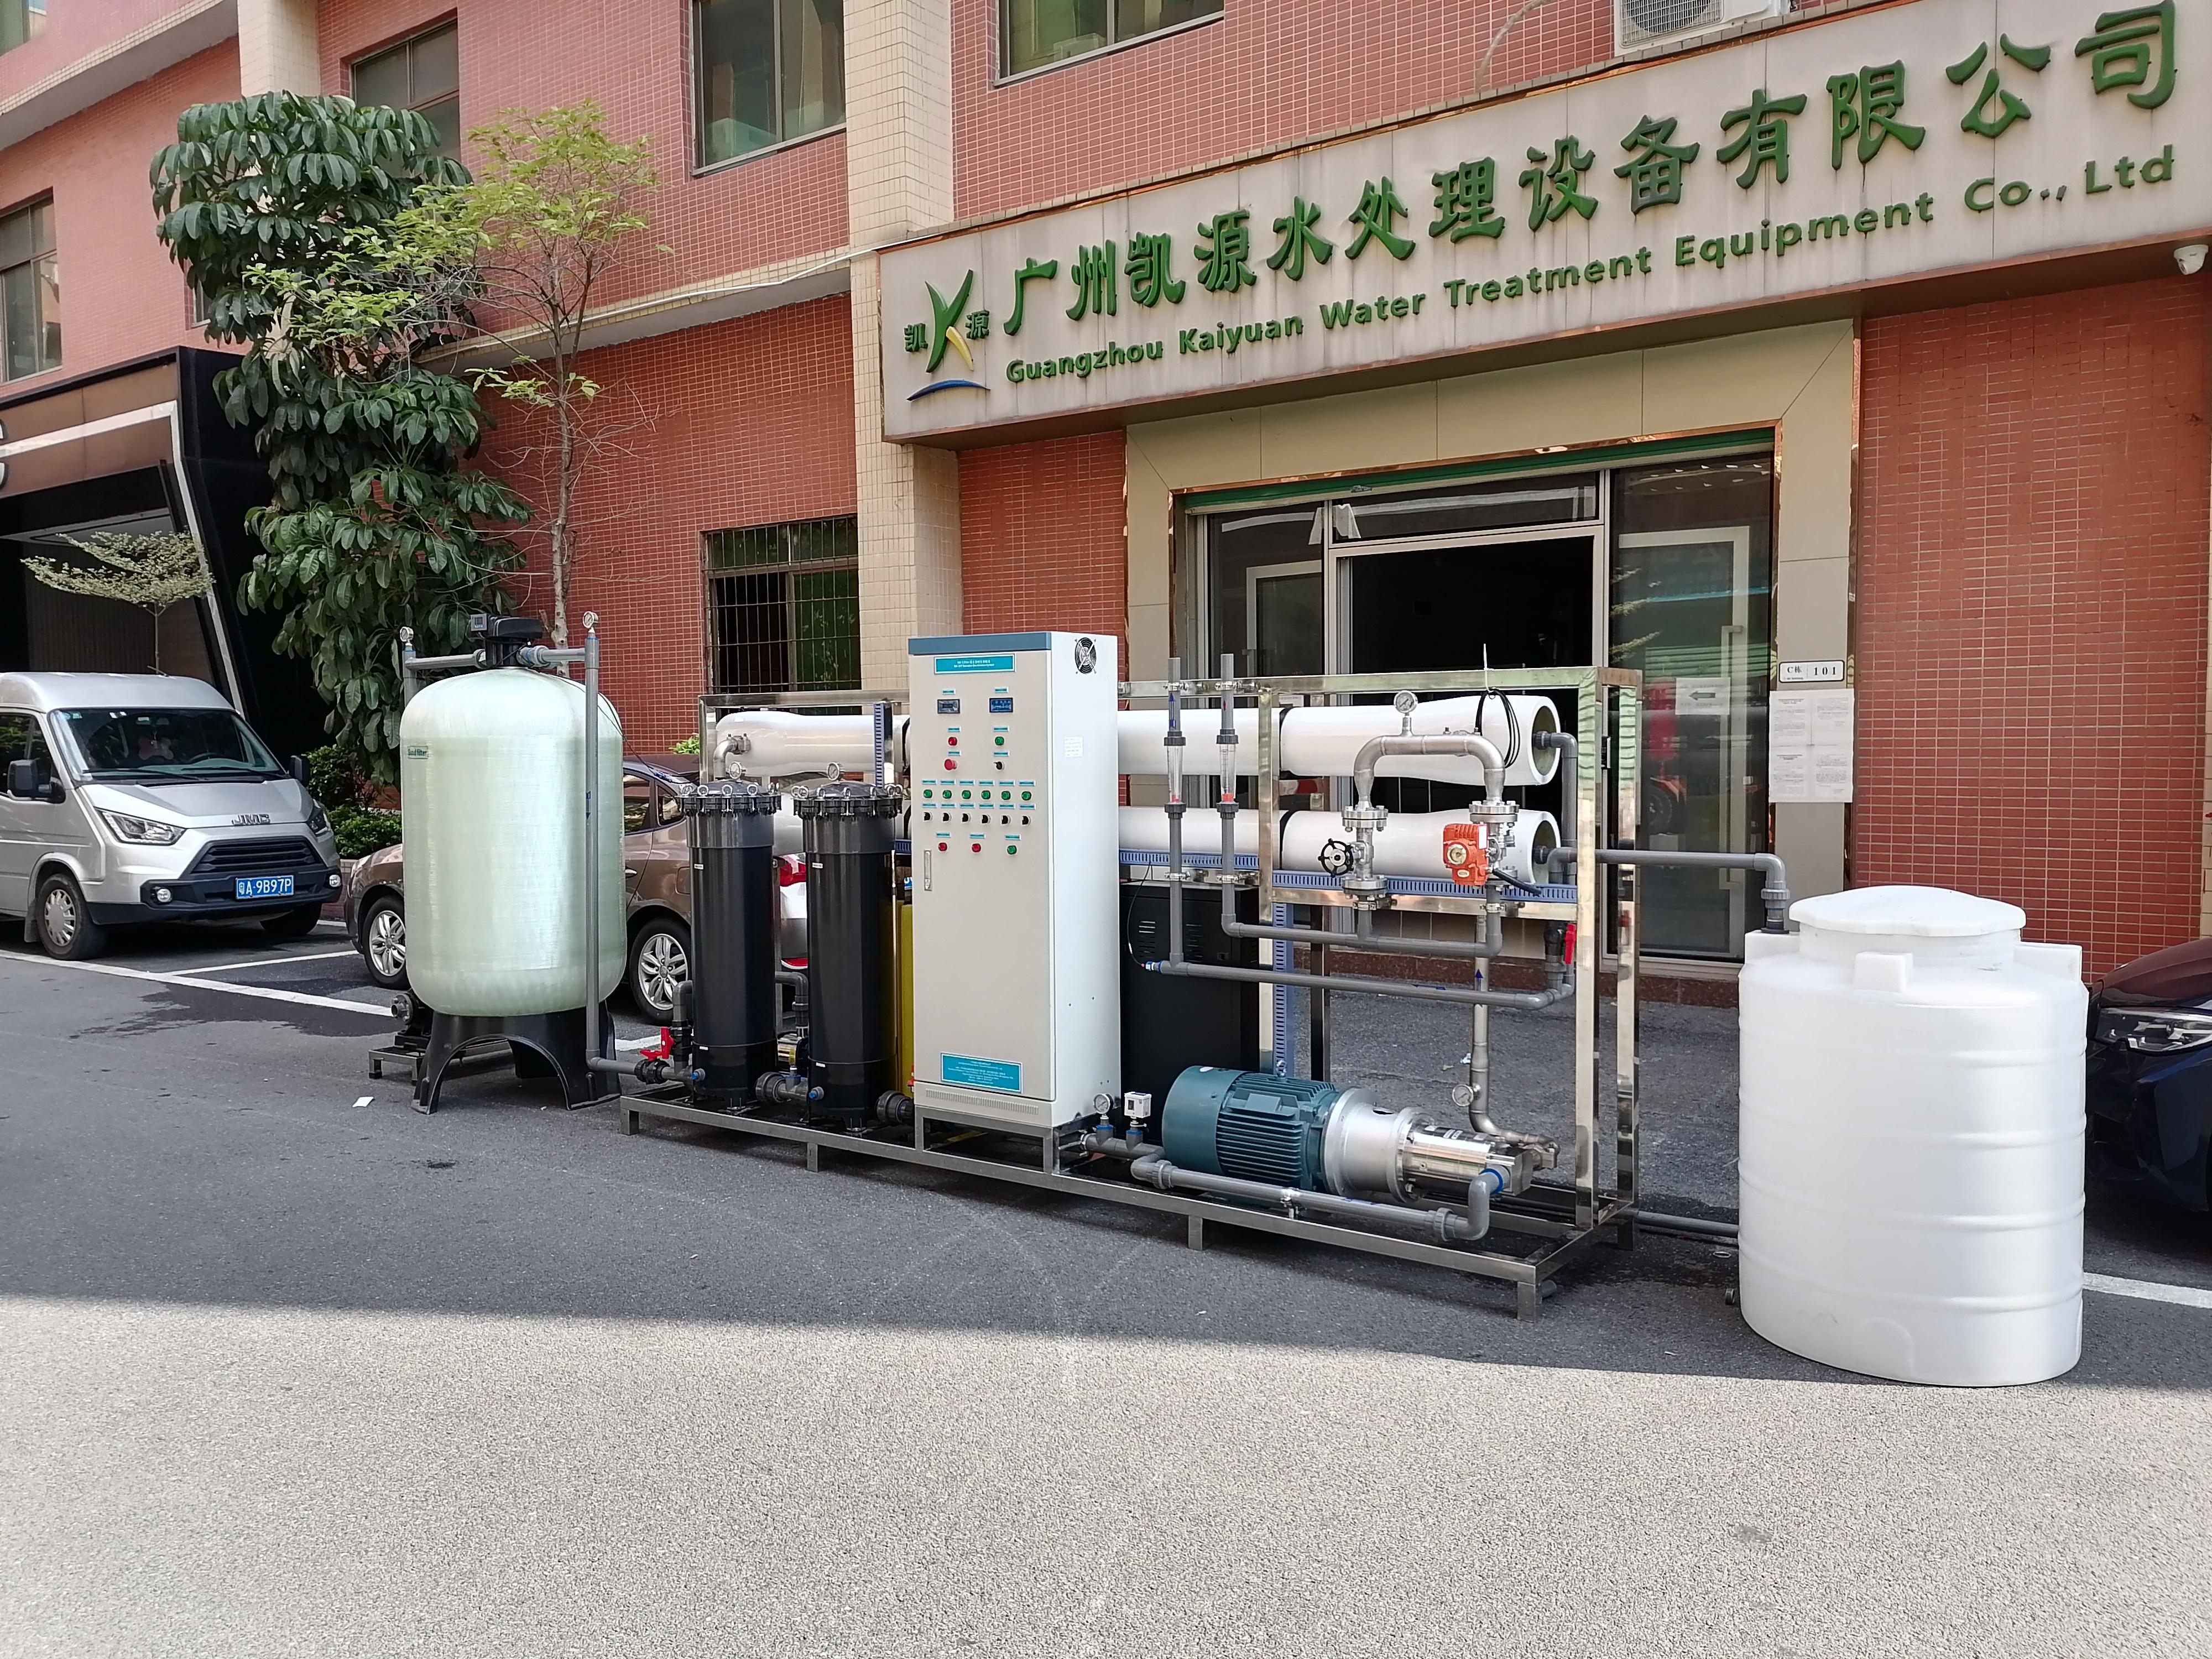
CIP cycles have absolute limits. Sometimes, standard cleaning protocols fail completely. If a rigorous CIP cannot restore performance to within 10% of the original startup baseline, trouble exists. The membrane has likely suffered irreversible fouling. The foulants have permanently embedded into the dense polymer matrix. You cannot chemical-wash your way out of this situation. The baseline degradation is permanent. Continuing to clean a dead membrane only wastes expensive chemicals and valuable labor hours.
Operational accidents destroy membranes quickly. You must monitor for signs of chemical oxidation constantly. Accidental chlorine exposure strips the rejection layer immediately. Once oxidation occurs, salt passage skyrockets. Mechanical damage also forces immediate replacement. Extreme differential pressure causes a phenomenon known as water hammer. Sudden valve closures generate massive hydraulic shocks. This can lead to membrane telescoping. In severe cases, the outer fiberglass shell cracks entirely. Damaged elements compromise the entire vessel.
We must establish a clear decision-stage framework. Fouled membranes require higher feed pressure to produce water. Higher pressure means higher energy bills. You reach an economic tipping point eventually. When operating at a lower flux or higher feed pressure costs more in annual electricity than financing a membrane replacement, you must act. Replacement becomes the necessary business decision. Continuing to operate failing elements drains profitability. Financial analysis should drive this transition, not emotional attachment to hardware.
Pretreatment acts as the ultimate lifeline for your RO system. Effective upstream filtration dictates RO lifespan directly. You must manage the Silt Density Index (SDI) and turbidity strictly. Plants utilize ultrafiltration (UF) or advanced multimedia filters to achieve this. Poor pretreatment allows suspended solids to bombard the delicate RO elements. Proper filtration captures these particles before they reach the high-pressure pumps. Investing heavily in pretreatment yields the highest return on investment.
Regulatory requirements dictate operational choices heavily. Running a Seawater Desalination System for Drinking Water requires strict adherence to WHO guidelines. Local municipal standards also enforce strict boron and total dissolved solids (TDS) limits. Drinking water applications demand pristine, uncompromising quality. Therefore, membranes may need replacement sooner to meet strict compliance mandates. Standard industrial applications might tolerate slight quality drifts. Drinking water systems simply cannot afford regulatory breaches.
Operators often attempt to maximize water production blindly. Pushing recovery rates too high creates severe operational risks. High recovery concentrates salts excessively in the tail elements. This accelerates mineral scaling rapidly. Heavy scaling shortens the replacement cycle drastically. You must balance desired output against membrane longevity carefully. A conservative recovery rate often yields a much longer, stable lifespan. Aggressive recovery requires aggressive, frequent cleaning cycles.
Pretreatment Technology | Average SDI Target | Impact on RO Membrane Lifespan |
|---|---|---|
Basic Multimedia Filtration | < 4.0 | Moderate (3-4 years). Requires more frequent CIP interventions. |
Advanced Ultrafiltration (UF) | < 2.5 | Excellent (5+ years). Significantly reduces cleaning frequency. |
Poor or Failing Pretreatment | > 5.0 | Severe degradation (1-2 years). High risk of irreversible fouling. |
A replacement cycle presents a strategic opportunity for your facility. You must decide between upgrading versus replacing like-for-like. Analyze historical plant data carefully before making a purchase. High-rejection elements might solve recurring TDS compliance issues. Low-energy elements can drastically reduce electricity bills in older facilities. Fouling-resistant chemistry works best for highly challenging feedwaters. Do not automatically reorder the exact same model. Technology improves constantly. Modern elements offer superior hydraulic performance compared to older designs.
Choosing the right membrane partner is critical for long-term success. Look for manufacturers that provide robust projection software. This software predicts long-term performance under your specific feed conditions accurately. Demand transparent warranty conditions from your supplier. Pro-rated warranties based on operational data logging protect your investment. The supplier should reward proper data management. Proven field references demonstrate real-world reliability. Ask for case studies from facilities operating under similar feedwater salinities.
Never replace an entire plant blindly. You must verify actual versus projected performance first. A structured piloting approach mitigates massive financial risk. We strongly recommend following a phased implementation strategy:
Select a single representative pressure vessel in your plant.
Install the new membrane models inside this specific vessel.
Log normalized performance data rigorously for 30 to 90 days.
Compare empirical field data against the manufacturer's software projections.
Execute the plant-wide rollout only after successful field validation.
This strategy minimizes unforeseen compatibility issues. It guarantees the selected elements will perform exactly as expected under your specific site conditions. Piloting proves the economic viability before you commit massive capital.
Managing SWRO membranes requires a heavily proactive approach. You cannot rely on reactive maintenance if you want to remain profitable. Consistent data-logging empowers you to make informed, highly strategic decisions. Tracking normalized flow, differential pressure, and salt passage prevents irreversible damage. You optimize energy usage by intervening at the exact right time. Your plant operates more efficiently when you align maintenance schedules with actual membrane health rather than a generic calendar.
Take action today to protect your facility. First, audit your normalized data logs to identify any hidden performance drops. Second, evaluate your current pretreatment efficacy to see if upstream improvements can extend membrane life. Finally, consult with a membrane specialist to run a projection on potential energy savings from a system-wide replacement. Proactive monitoring guarantees long-term operational success and compliance.
A: The scale of operation matters significantly. Home RO systems typically last 1-2 years based purely on calendar time. In contrast, industrial SWRO membranes last 3-5 years or more. Their lifespan depends strictly on hydraulic data, normalized performance tracking, and the quality of upstream pretreatment.
A: Yes. Excessive CIP maintenance, such as cleaning more than once a month, damages the elements. Frequent exposure to harsh pH swings degrades the delicate polyamide layer. This accelerates chemical breakdown, permanently altering salt rejection capabilities and significantly shortening overall lifespan.
A: Differential pressure variations reveal the foulant type. Increases in front-stage differential pressure usually indicate particulate or organic fouling blocking the feed channels. Conversely, pressure spikes in the last stage point toward inorganic scaling, such as silica or calcium carbonate, precipitating at high concentrations.
A: Mixing new, high-permeability membranes with old, fouled ones creates severe flux imbalances. The new element absorbs the majority of the flow. This localized over-fluxing causes the new membrane to foul rapidly. You should always replace entire vessels uniformly to maintain balanced hydraulics.


