


Views: 0 Author: Site Editor Publish Time: 2026-08-16 Origin: Site


Recovery rate stands as the single most critical variable in any desalination project. It perfectly balances initial capital expenditure against daily operational costs. In seawater reverse osmosis (SWRO), we define the recovery rate simply. It is the percentage of fresh permeate water extracted from the total incoming feedwater volume. Buyers naturally want the highest possible water yield. They often seek systems maximizing every drop of raw seawater. However, physical chemistry imposes harsh limits. Thermodynamic realities and energy costs dictate a strict optimal window for commercial viability. You cannot simply force more water through the membranes without facing severe financial and mechanical consequences. Finding this operational sweet spot ensures your facility runs efficiently for decades. We will explore standard recovery baselines below. You will learn the physics restricting these limits and how to spot unrealistic vendor promises. Understanding these factors helps you evaluate long-term system efficiency properly.
The industry standard recovery rate for a seawater desalination plant operates tightly between 35% and 45%, heavily dependent on feedwater salinity and temperature.
Pushing recovery rates above 50% in single-pass SWRO systems dramatically increases osmotic pressure, leading to diminishing returns in energy efficiency.
Integrating Energy Recovery Devices (ERDs) and advanced pre-treatment are the most verifiable methods to optimize a seawater desalination system for drinking water without accelerating membrane failure.
Evaluating vendor claims requires looking past "maximum recovery" and calculating the total lifecycle cost per cubic meter of produced water.
Industry data shows 35% to 45% remains the commercial standard for treating typical seawater. Standard seawater generally contains about 35,000 parts per million (ppm) of Total Dissolved Solids (TDS). Operating within this 10% window provides the safest balance between water yield and energy consumption. Plant operators rely on this baseline to predict daily operational expenses accurately. Exceeding this baseline requires specialized equipment and significant energy sacrifices.
Many people wonder why seawater recovery remains so much lower than brackish water systems. Brackish water plants frequently achieve 75% to 85% recovery. The answer lies entirely in osmotic pressure. When you extract pure water from seawater, the remaining salt concentrates in the brine stream. This concentration exponentially increases the osmotic pressure inside the membrane housing. Overcoming this immense pressure requires massive amounts of electrical energy driving high-pressure pumps.
Common Mistake: Operators often try applying brackish water operational models to seawater plants. This approach always leads to catastrophic membrane failure and overwhelming energy bills.
Global oceans do not share the same chemistry. Regional differences heavily dictate your baseline recovery expectations. You must adjust your targets based on local geography.
The Arabian Gulf: Feedwater here often exceeds 45,000 ppm TDS. High salinity drops the realistic recovery baseline down to 35% or lower.
The Pacific Ocean: Salinity hovers around 33,000 ppm to 35,000 ppm. Plants here comfortably target 40% to 45% recovery.
The Red Sea: Extreme temperatures and high salinity create severe fouling risks. Operators usually cap recovery near 38% to protect equipment.
Your local feedwater profile ultimately sets the physical boundaries for your project. A thorough water analysis provides the only reliable starting point.
Pushing a plant past the 45% recovery mark introduces significant mechanical and financial risks. Thermodynamics govern every aspect of reverse osmosis. Extracting more fresh water forces the remaining brine into a highly concentrated state. Pumping this thick brine requires specialized, energy-intensive equipment.
Higher recovery demands higher feed pressure. Standard RO membranes can only withstand so much pressure before degrading. Beyond a certain operational point, the energy required to overcome osmotic pressure costs far more than simply drawing additional raw feedwater. Generating an extra 5% of permeate water might require a 20% increase in electrical consumption. This diminishing return destroys facility profit margins quickly.
The chart below illustrates how energy demands spike as recovery rates climb past the optimal zone.
Energy Consumption vs. Recovery Rate Chart
Recovery Rate Target | Required Feed Pressure (Bar) | Energy Consumption Impact | Commercial Viability |
|---|---|---|---|
35% | 55 - 60 | Baseline / Optimized | Highly Viable |
40% | 60 - 65 | Moderate Increase | Standard Viability |
45% | 65 - 70 | High / Maximum Efficiency | Viable with ERDs |
50%+ | 75 - 85+ | Exponential Spike | Economically Unviable |
Higher recovery leaves less water to dilute the rejected salts. This lower brine volume accelerates mineral scaling. Calcium sulfate and silica precipitate rapidly onto the membrane surface when pushed beyond natural limits. Additionally, organic matter concentrates, creating a perfect breeding ground for biofouling. Fouled membranes require intense chemical cleaning to restore flow rates.
Forcing high recovery drastically shortens equipment life. The operational expenditure (OPEX) impact becomes severe over a standard five-year cycle. You will face several costly operational realities:
More Frequent CIP Cycles: Clean-In-Place procedures will double or triple in frequency, halting plant production.
Increased Chemical Dosing: You will spend significantly more on antiscalants and biocides to prevent sudden scaling.
Faster Membrane Degradation: Aggressive cleaning chemicals break down the delicate polyamide layer on RO membranes.
Premature Replacement: You will need to replace expensive membrane elements years ahead of schedule.
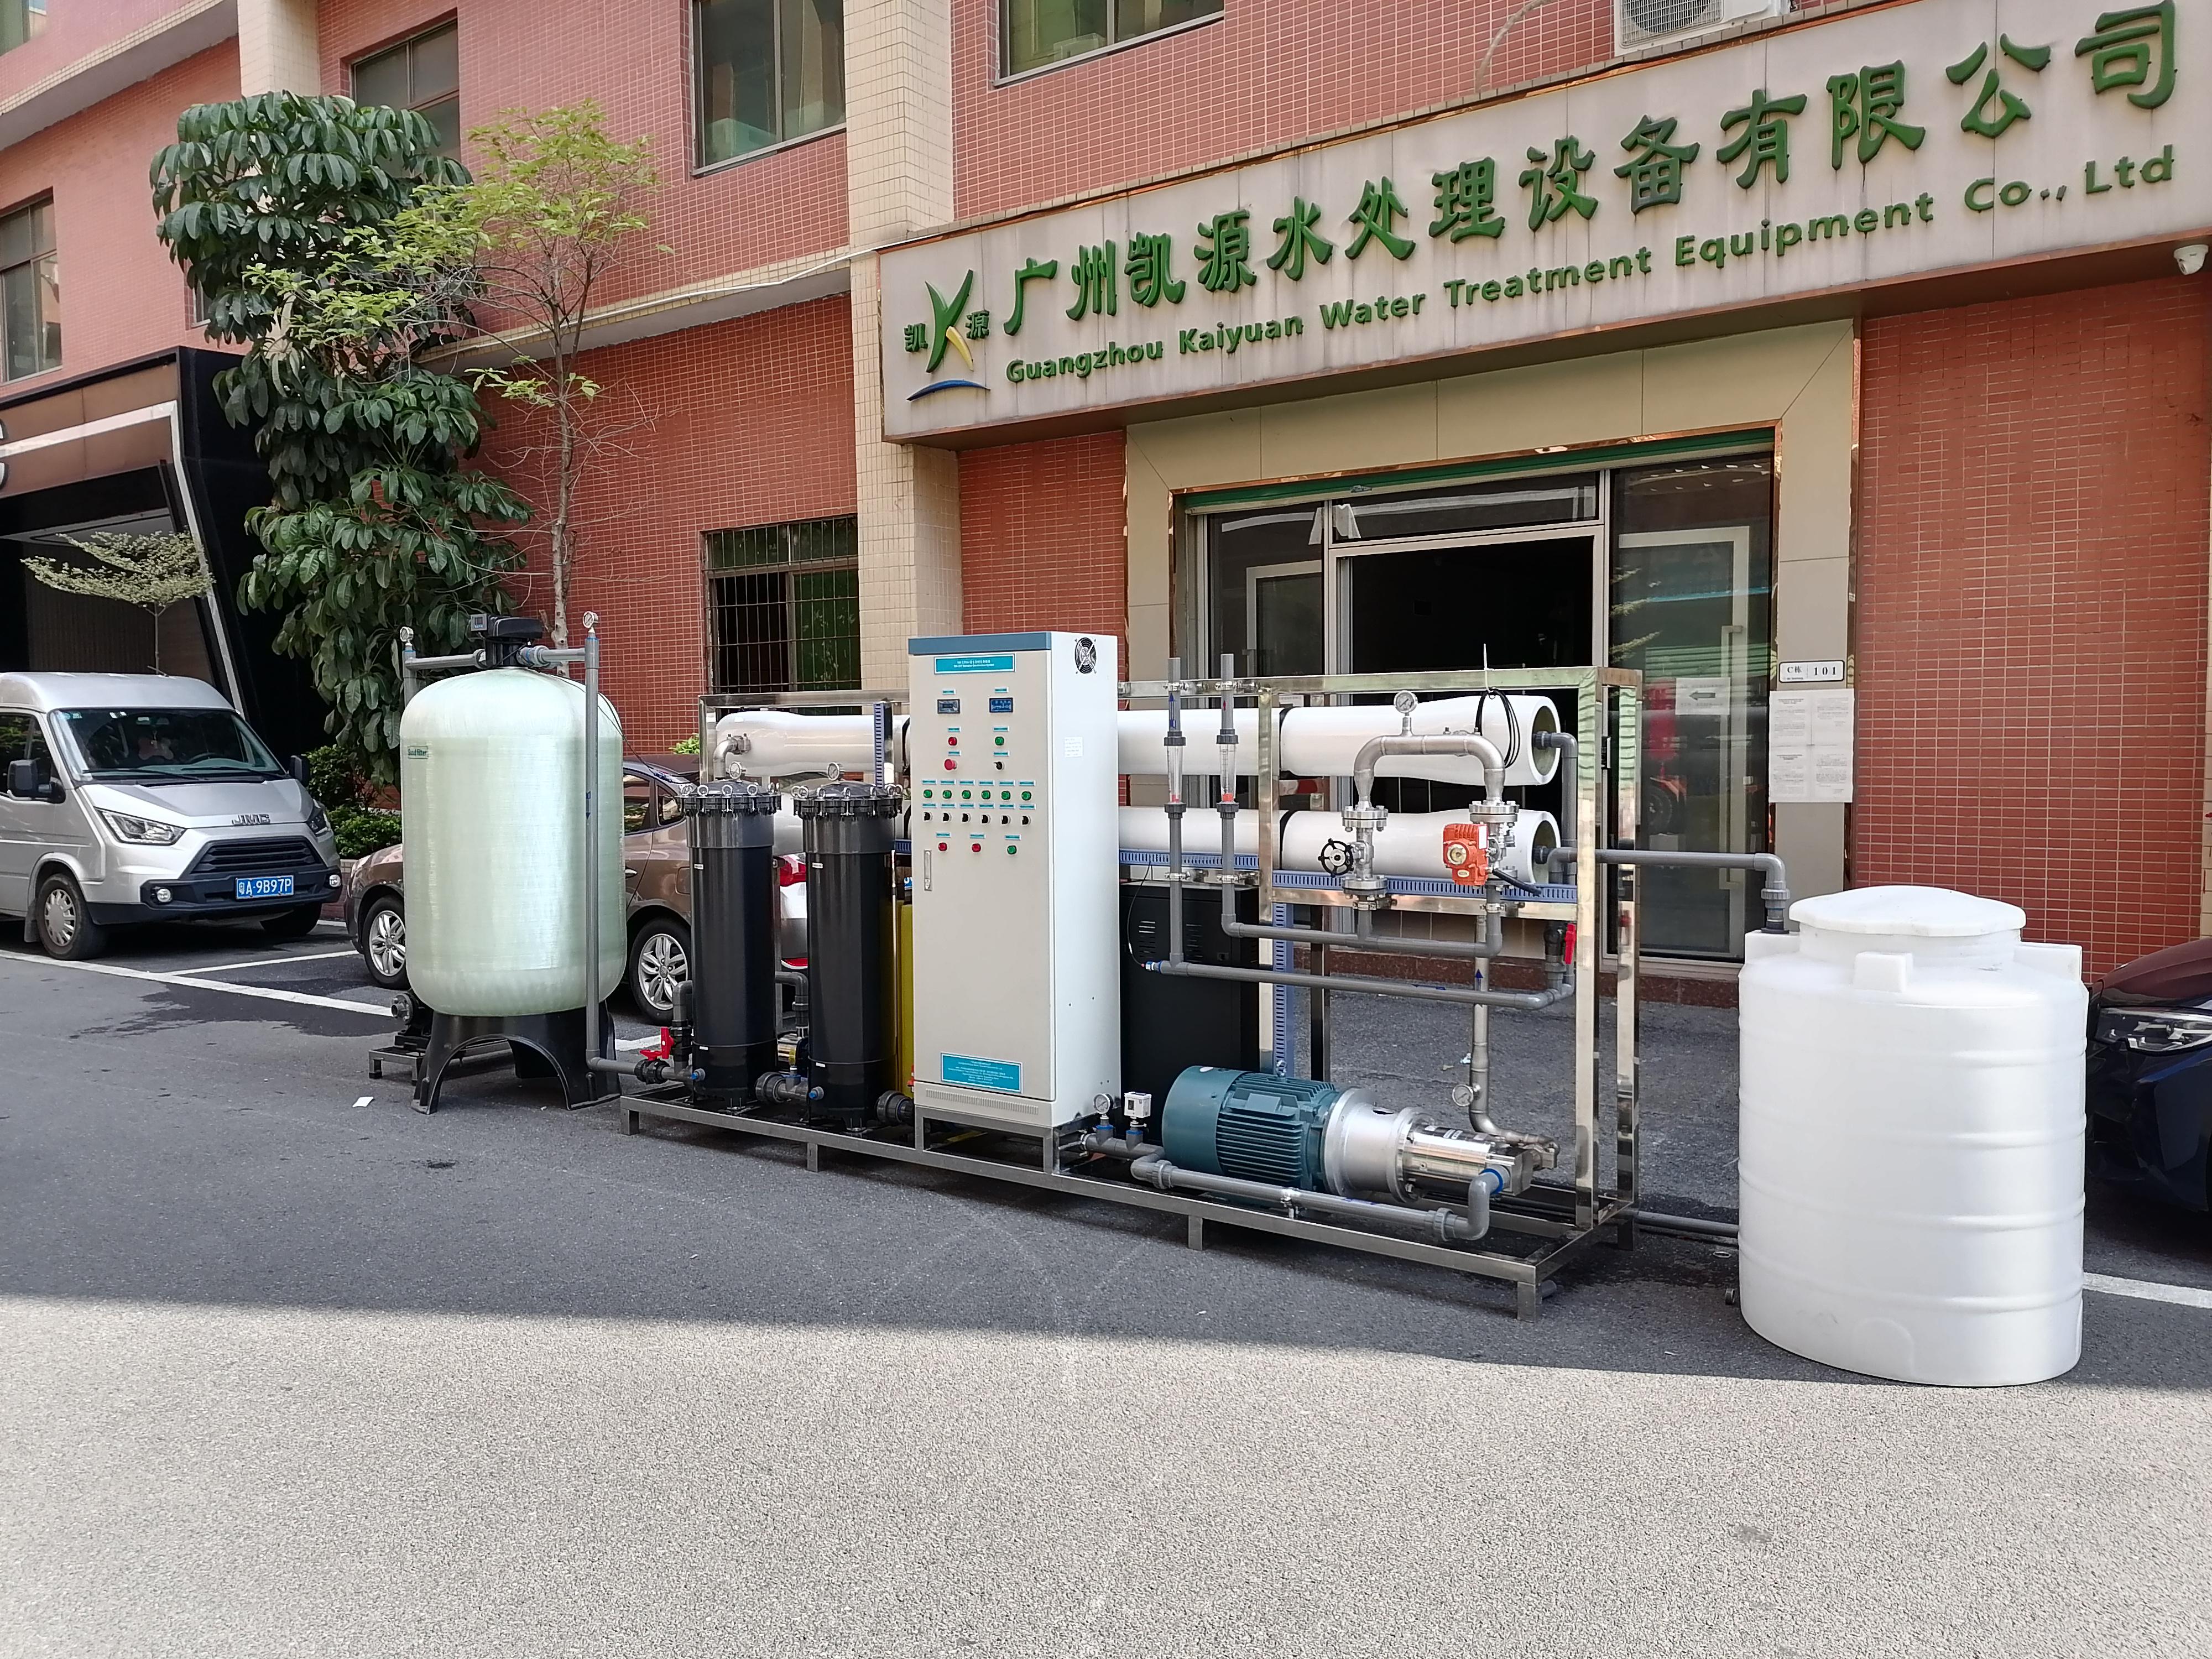
Reaching the upper limit of the 40-45% recovery bracket safely requires exceptional engineering. You cannot rely on standard pumps and basic filters. Modern plants utilize sophisticated technologies to sustain these rates without damaging components. Building a reliable Seawater Desalination System for Drinking Water demands strict attention to energy recovery and pre-treatment design.
You cannot operate a modern high-recovery facility profitably without Energy Recovery Devices. Isobaric ERDs, such as pressure exchangers, capture hydraulic energy from the high-pressure reject brine. They transfer this otherwise wasted energy directly back into the incoming feedwater. This process reduces the load on the main high-pressure pump by up to 60%. ERDs make achieving 40% to 45% recovery economically viable by completely altering the thermodynamic cost structure.
Best Practice: Always specify isobaric pressure exchangers over older Pelton wheel designs. Isobaric technology routinely achieves energy transfer efficiencies exceeding 95%.
Single-pass systems struggle to meet stringent drinking water standards at high recovery rates. Multi-stage configurations solve this problem. Engineers frequently use two-pass or split-partial RO systems. In a split-partial design, the system routes the highest quality permeate directly to the product tank. It then re-processes the lower quality permeate from the tail-end elements. This configuration balances overall recovery, minimizes energy load, and ensures excellent boron removal for municipal drinking water.
Many buyers mistakenly believe advanced pre-treatment directly boosts recovery rates. This is false. Ultrafiltration (UF) and Dissolved Air Flotation (DAF) act as strict risk mitigators. They remove suspended solids, algae, and organics before water reaches the RO membranes. Pristine feedwater allows the plant to safely sustain its top-end 45% recovery target without succumbing to rapid fouling. Poor pre-treatment forces operators to lower recovery rates just to keep the plant running.
The desalination industry features fierce competition. Some vendors may exaggerate performance metrics to win lucrative contracts. Buyers must apply a skeptical framework when evaluating proposals. Understanding how to dissect these claims protects you from purchasing an underperforming system.
You should instantly question any vendor promising 50% or higher recovery on a standard SWRO system treating typical seawater. If they do not detail the corresponding energy penalties, they are hiding the true operational cost. High recovery without proprietary multi-stage engineering usually indicates theoretical software modeling rather than practical field experience. Beware of proposals missing detailed energy consumption guarantees.
Never accept a flat recovery percentage without context. You must ask vendors for their projected RO software reports. Industry-standard software includes ROSA or WAVE projections. When reviewing these reports, check the underlying assumptions carefully.
What is the assumed feedwater temperature range? (Cold water requires much more pressure).
What membrane age did they input? (Five-year-old membranes perform much worse than day-one membranes).
What are the average flux rates across the lead elements? (Excessively high flux leads to rapid fouling).
Theoretical recovery under lab conditions looks impressive on paper. However, guaranteed recovery under continuous commercial operation determines your actual success. Ensure your vendor contract includes binding performance guarantees for energy consumption and permeate quality over a multi-year period.
Vendor Evaluation: Reality vs. Hype
Evaluation Metric | Reliable Vendor Characteristics | Red Flag Vendor Characteristics |
|---|---|---|
Recovery Claims | Sticks to 35-45% based on local water data. | Promises 50%+ without specialized engineering. |
Projection Reports | Provides full WAVE/ROSA reports showing 5-year membrane aging. | Provides day-one performance metrics only. |
Energy Consumption | Guarantees specific kWh/m³ based on feed pressure variations. | Omits energy consumption penalties at peak recovery. |
Pre-treatment Design | Tailors UF/DAF to seasonal algae blooms and local turbidity. | Offers a generic sand filter for all seawater types. |
Decision-makers often hyper-focus on maximizing recovery. This mindset usually leads to poor financial outcomes. Instead, you must shift your decision-making lens toward minimizing the lifecycle cost per cubic meter of produced water. A well-designed Seawater Desalination Plant prioritizes long-term financial predictability over short-term yield records.
Every extra drop of water extracted at the edge of the physics limit costs exponentially more money. You must calculate the cost of electricity, membrane replacements, chemical usage, and labor. A plant running comfortably at 40% recovery often produces cheaper water over a ten-year span than a stressed plant forced to run at 48%. Finding the lowest lifecycle cost per cubic meter ensures your facility remains profitable regardless of minor market fluctuations.
Sometimes, pushing for higher recovery genuinely makes economic sense. You must evaluate your intake and outfall constraints. If raw water intake structures require massive offshore tunneling, drawing less water saves immense construction capital. Similarly, if local environmental regulations strictly limit the volume of brine you can discharge back into the ocean, you must extract as much fresh water as possible to minimize outfall volume. In these specific scenarios, the higher OPEX of high-recovery systems offsets the prohibitive CAPEX of marine civil works.
Do not write equipment procurement specifications blindly. Your very first action must be commissioning a site-specific feedwater analysis. You need exact data on seasonal TDS variations, temperature swings, and fouling indices (SDI). Once you have this data, you can model the precise lifecycle costs and determine your ultimate recovery target.
The 35-45% recovery rate remains the industry's undisputed sweet spot. It perfectly balances daily water production, long-term membrane health, and overall energy consumption. Straying beyond these boundaries requires specialized technology and careful financial modeling. Always remember, a reliable facility is designed for operational stability and predictable expenses, not just peak theoretical efficiency. You want a system running smoothly day after day without demanding constant maintenance interventions. We strongly recommend consulting with experienced system engineers. Ask them to perform a localized feasibility study and generate transparent RO projections. This step establishes accurate baseline targets and guarantees your project starts on a solid foundation.
A: Recovery rate measures water yield. It is the percentage of fresh water produced from the total incoming feedwater. Rejection rate measures salt removal. It indicates the percentage of dissolved solids and impurities the RO membranes successfully block from entering the fresh permeate stream.
A: Seawater contains significantly higher initial Total Dissolved Solids (TDS). This high salinity creates massive osmotic pressure. Extracting fresh water concentrates the remaining salt quickly. The pressure required to push water through the membrane becomes too high for standard equipment to handle efficiently, limiting recovery compared to brackish water.
A: Increasing recovery reduces the physical volume of the brine discharged. However, it significantly increases the brine's concentration and salinity level. This highly concentrated brine can create severe environmental compliance issues regarding ocean outfall regulations, as it impacts local marine ecosystems more harshly.
A: Warmer feedwater lowers water viscosity, meaning it requires less feed pressure to pass through the membranes. While this improves energy efficiency, warm water also accelerates biological fouling rates and slightly reduces the membrane's ability to reject salt, potentially compromising drinking water quality.


