


Views: 0 Author: Site Editor Publish Time: 2026-08-18 Origin: Site


Membrane fouling goes beyond a simple technical hiccup. It acts as the primary driver of unscheduled downtime and massive operational expenditure (OPEX) in desalination facilities worldwide. Facility managers face this expensive reality every single day. Reverse osmosis (RO) remains the industry standard for water purification. However, fluctuating feed water conditions constantly threaten membrane integrity. Seasonal algal blooms and sudden temperature shifts create harsh operational environments. When fouling occurs, water production drops rapidly. Energy costs simultaneously skyrocket as pumps work harder. Identifying the exact fouling mechanism remains your crucial first step. You must understand these root causes before evaluating pretreatment solutions. This knowledge also proves essential when upgrading an existing Seawater Desalination Plant. We will explore the primary causes of RO membrane failure. You will also learn practical diagnostic frameworks and vendor selection criteria to ensure long-term, highly efficient water production.
Membrane fouling fundamentally falls into four categories: biological, organic, inorganic (scaling), and particulate/colloidal.
A 15% increase in differential pressure or a 10% drop in normalized permeate flow are the industry-standard indicators that fouling has reached a critical intervention threshold.
Selecting a high-efficiency Seawater Desalination System for Drinking Water requires evaluating vendors based on their pretreatment architecture (e.g., UF vs. conventional media) and chemical dosing protocols.
There is no "zero-fouling" membrane; credible solutions focus on extending Clean-In-Place (CIP) intervals and maximizing membrane lifespan through continuous feed water monitoring.
Fouled RO elements create a ripple effect across a facility's entire balance sheet. Ignoring early warning signs inevitably transforms a minor maintenance task into a major financial liability. We can categorize this business impact into three critical areas.
Energy consumption represents the largest single OPEX in desalination. Fouled membranes directly attack this metric. As contaminants block the microscopic pores of the membrane, permeability decreases. The high-pressure pumps must deliver significantly higher feed pressure to maintain the same permeate flow rate. This increased pressure draws more electrical power per cubic meter of produced water. Even a marginal increase in feed pressure translates into thousands of dollars in wasted electricity over a few months.
Fouling does not just restrict flow. It often degrades the membrane surface over time. Compromised membranes risk higher salt passage. As permeate conductivity rises, overall water quality drops. This creates severe compliance risks. Municipal drinking water standards demand strict adherence to specific salinity and purity thresholds. If a plant fails to meet these compliance standards, operators must blend water, reduce production capacity, or shut down entirely until the issue resolves.
RO membranes represent a massive capital investment. Under ideal conditions, elements last between three and five years. Predictable, scheduled end-of-life replacements allow for accurate budget forecasting. However, irreversible fouling destroys this timeline. It forces facilities to replace RO elements prematurely. Emergency procurement of replacement membranes drains capital reserves. It also requires extensive manual labor to swap out elements across pressure vessels.
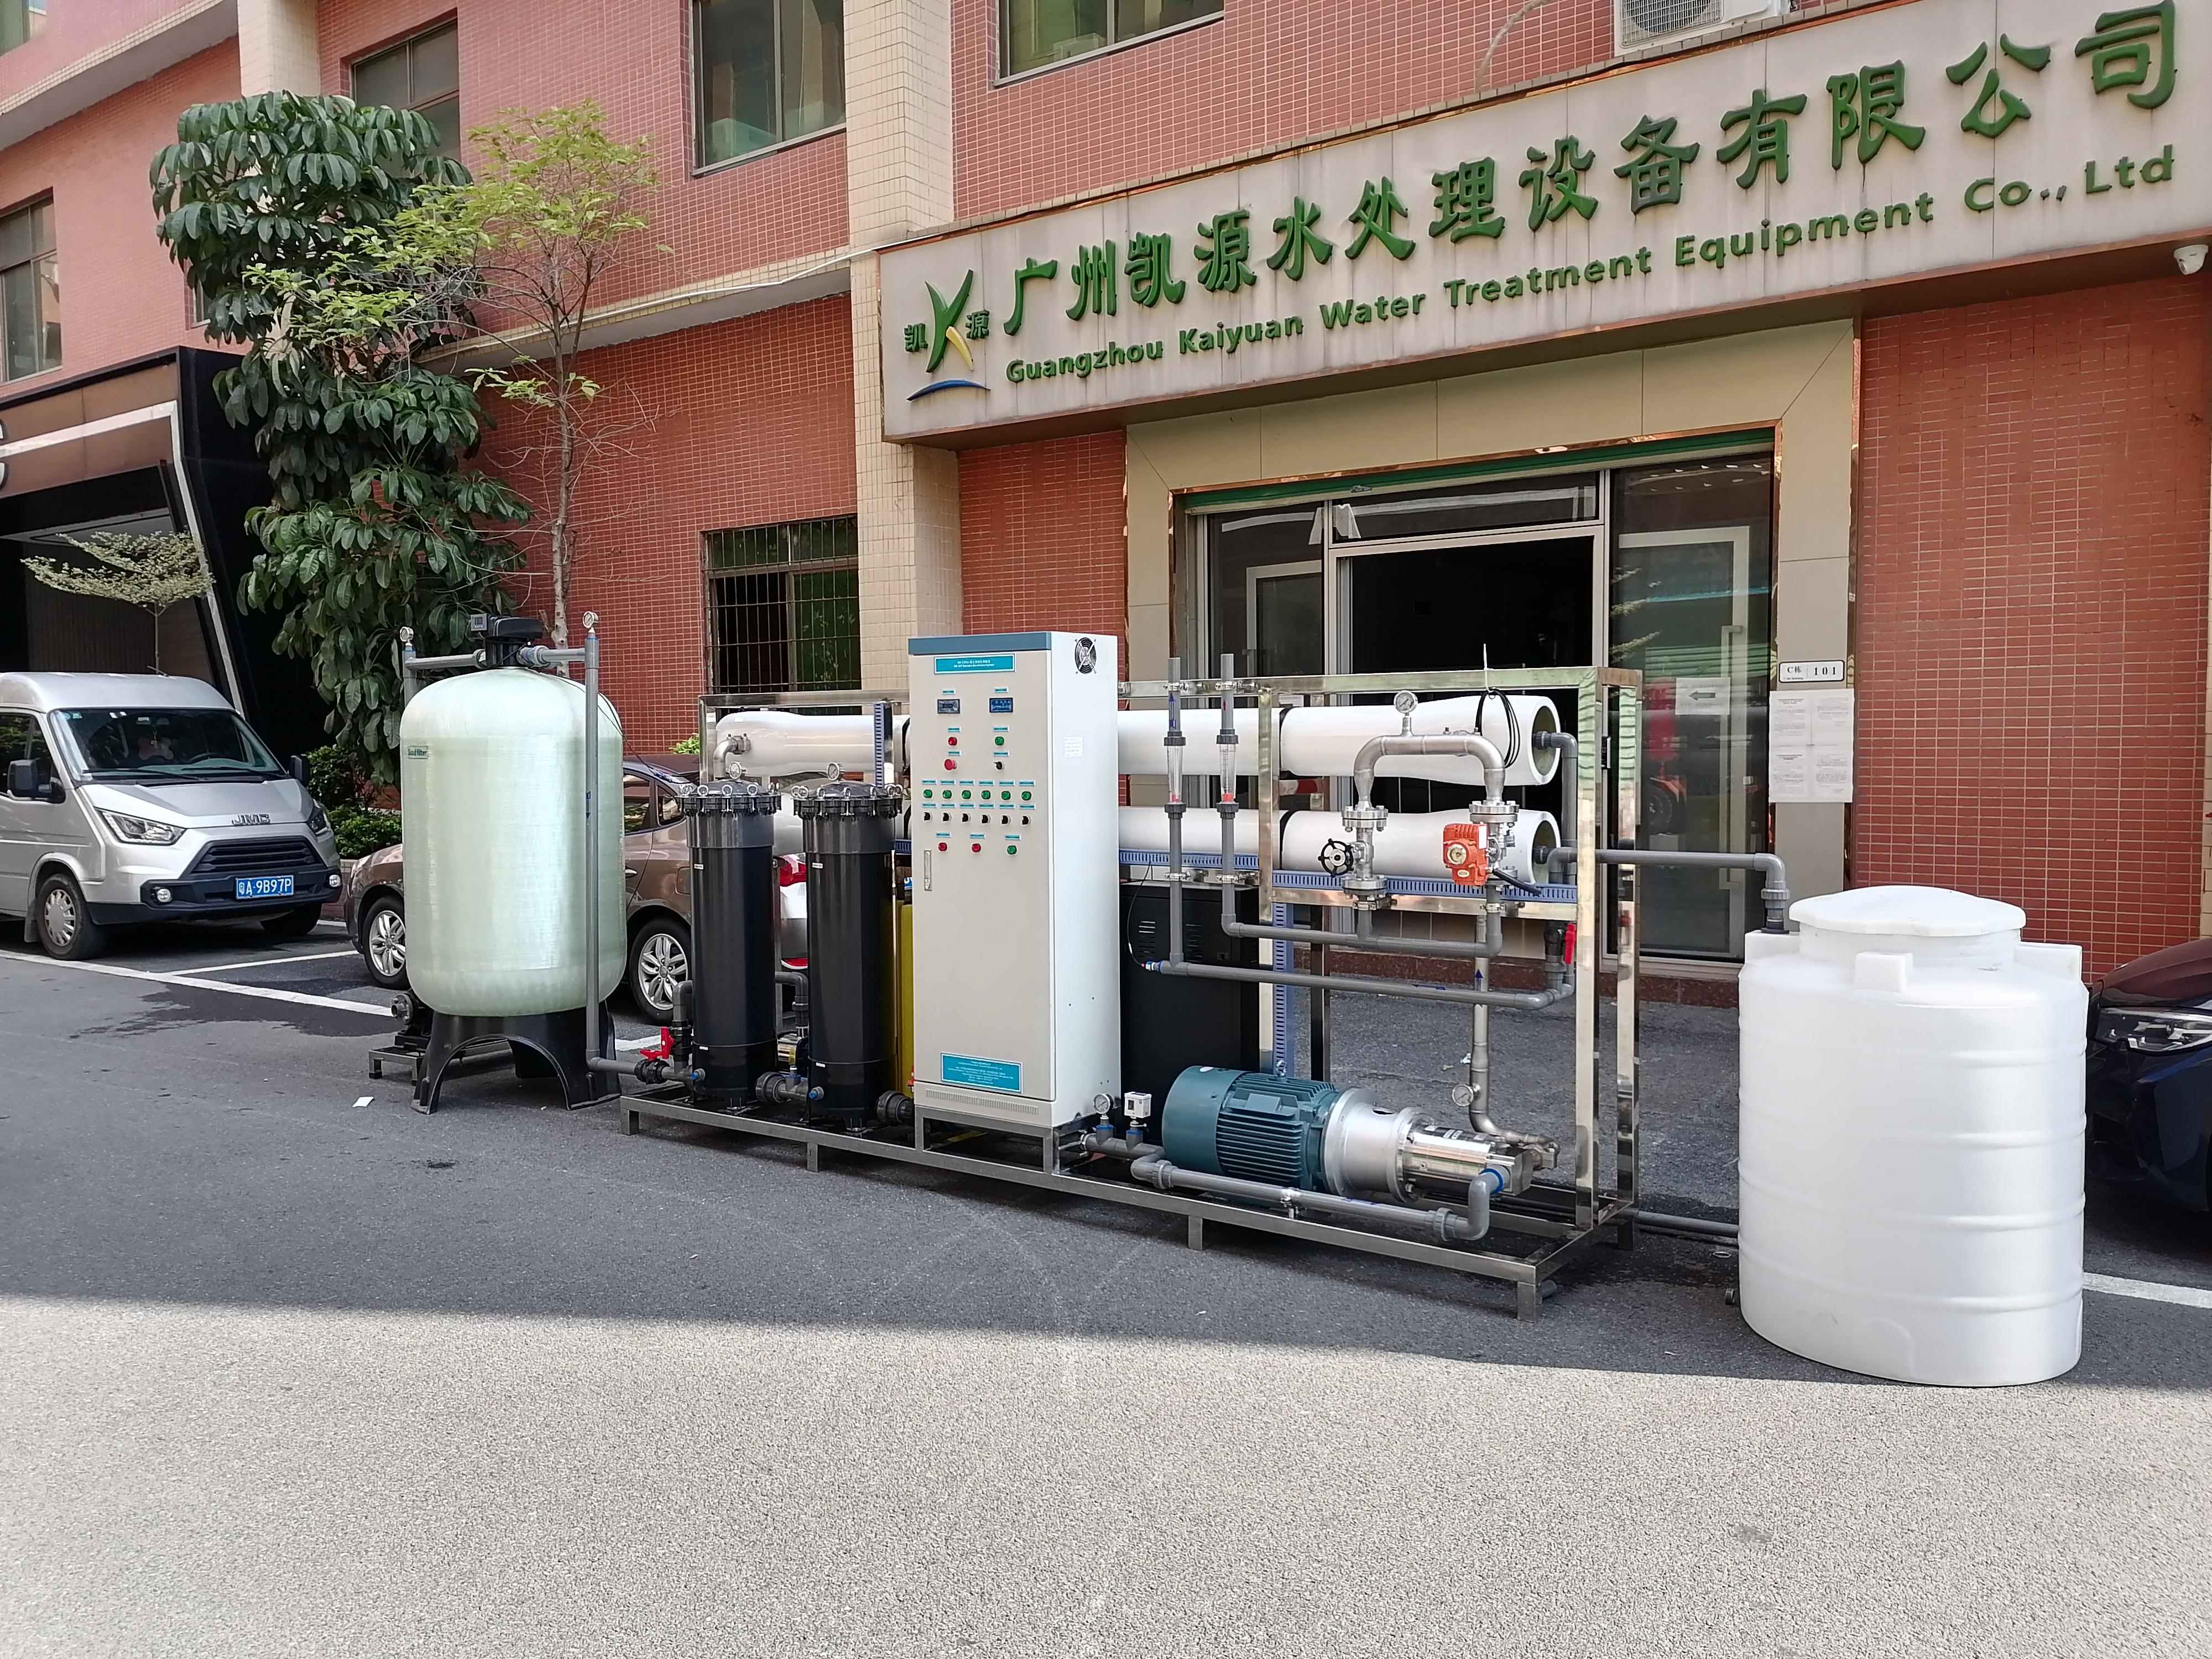
Understanding what physically blocks your membranes allows you to deploy the correct countermeasures. The desalination industry recognizes four distinct fouling mechanisms. Let us examine each type.
Marine environments teem with microorganisms. When these bacteria enter the RO system, they adhere to the membrane surface. They quickly form a sticky extracellular polymeric substance (EPS). This EPS biofilm acts as a protective shield. Biofouling accounts for the vast majority of SWRO membrane failures worldwide. It thrives aggressively in warm seawater environments carrying high organic nutrient loads. Once established, biofilms resist conventional chemical cleaners and rapidly spread across the membrane surface.
Scaling occurs due to basic chemistry. As feed water moves across the membrane, pure water passes through, leaving dissolved salts behind in the concentrate stream. This causes concentration polarization. When sparingly soluble salts exceed their solubility limits at the membrane surface, they precipitate. Common culprits include calcium carbonate, calcium sulfate, and barium sulfate. These precipitated minerals crystallize directly onto the polymer layer, creating a hard, impenetrable crust.
Seawater contains various dissolved organic compounds. Natural organic matter (NOM), humic acids, and trace oils frequently bypass basic filtration. These substances deposit themselves onto the membrane polymer. They chemically bind to the surface, altering the membrane's inherent surface charge and hydrophobicity. Organic fouling typically causes a slow, steady decline in flux rather than sudden pressure spikes.
Suspended solids, silt, clay, and silica often escape pretreatment systems. Heavy rains, algal blooms, or nearby dredging operations can suddenly spike these levels. These particles accumulate inside the feed channels of the RO elements. This physical blockage restricts flow pathways. Particulate fouling correlates directly with high turbidity and a high Silt Density Index (SDI) in the feed water.
Here is a simplified diagnostic chart to help distinguish between these four mechanisms:
Fouling Category | Primary Foulants | Key Indicator Metric | Most Affected Zone |
|---|---|---|---|
Biological | Bacteria, EPS, Algae | Rapid dP increase, sticky residue | Lead elements (Front end) |
Inorganic (Scaling) | Calcium, Sulfates, Silica | Decreased salt rejection, hard crust | Tail elements (Concentrate end) |
Organic | Humic acids, Oils, NOM | Gradual flux decline | Lead elements |
Particulate | Silt, Clay, Sand | High SDI, elevated turbidity | Lead elements |
Guessing the cause of fouling wastes time and chemical resources. Plant managers must adopt a structured diagnostic framework. Follow these sequential steps to pinpoint the exact foulant.
Implement Data-Driven Monitoring: Do not rely on raw flow rates. You must track Normalized Permeate Flow (NPF), Differential Pressure (dP), and Salt Rejection rates daily. Normalization factors out natural temperature and pressure variations. A sudden 15% increase in normalized dP demands immediate attention.
Conduct Membrane Autopsies: When CIP protocols fail, you must perform destructive testing. Remove a lead-element membrane and send it to a specialized lab. Technicians use Scanning Electron Microscopy (SEM) paired with Energy Dispersive X-Ray (EDX) to map the elemental composition. Fourier Transform Infrared Spectroscopy (FTIR) accurately identifies organic and biological signatures. This data proves invaluable before investing in expensive system upgrades.
Analyze the Location of Fouling: The physical location of the foulant tells a story. Particulate matter and biofouling almost exclusively attack the lead elements at the front of the pressure vessel. Conversely, scaling predominantly affects the tail elements at the concentrate end, where salt concentrations reach their absolute peak.
Your RO membranes should never act as a primary filter. They require meticulously conditioned feed water. Evaluating and upgrading pretreatment architecture serves as your best defense mechanism.
Many legacy plants utilize dual-media filters containing sand and anthracite. While cost-effective, media filtration relies on gravity and depth. It struggles to handle sudden spikes in feed water turbidity. Ultrafiltration (UF) provides a definitive physical barrier. UF membranes feature microscopic pores that consistently block suspended solids and large pathogens. UF requires a smaller physical footprint, uses fewer conditioning chemicals, and delivers a highly consistent SDI reduction regardless of raw water fluctuations.
Chemical pretreatment requires precise balance. Biocides (like chlorine) control biological growth. However, polyamide RO membranes possess zero tolerance for free chlorine. Oxidation permanently destroys the membrane polymer. Therefore, if you chlorinate, robust dechlorination via sodium bisulfite (SMBS) dosing is non-negotiable. If dechlorination fails, membrane destruction occurs instantly. Additionally, operators must dose coagulants to bind small colloidal particles. You must also inject specific antiscalants to alter mineral crystallization patterns in the concentrate stream.
Robust pretreatment guarantees operational resilience. A well-integrated Seawater Desalination System for Drinking Water manages worst-case scenarios effortlessly. Whether facing seasonal red tides or severe coastal storms, a modernized pretreatment stage captures the contamination surge. It absorbs the operational shock without passing the heavy filtration burden downstream to the delicate RO elements.
When you prepare to upgrade your facility, choosing the right partner matters just as much as choosing the right technology. Use these criteria to evaluate potential vendors objectively.
Evidence of Resilient Design: Do not accept theoretical claims. Demand historical case studies. Ask vendors to show stable CIP frequencies from existing plants operating in similar regional seawater conditions. A vendor should demonstrate how their design handles local challenges like seasonal algae blooms.
Proprietary and Next-Gen Materials: Many manufacturers market "low-fouling" or zwitterionic membranes. Assess these claims with a highly skeptical lens. While technological advancements occur, real-world durability often differs from lab results. Request pilot testing data. Seek independent validation regarding how these specific materials hold up against aggressive, repeated chemical cleaning cycles over several years.
Automation and Control: Modern plants require intelligent oversight. Prioritize vendors offering systems with real-time SCADA integrations. The best platforms utilize AI logic to automatically adjust antiscalant and biocide dosing based on real-time incoming water conductivity and temperature sensors. This reduces human error and optimizes chemical consumption.
Successful desalination operations rely entirely on matching the right pretreatment architecture to your specific local seawater chemistry. Fouling will always present a challenge, but it does not have to remain an unpredictable operational crisis. By understanding the four main types of fouling, you can implement targeted countermeasures and protect your high-pressure pumps from energy spikes.
Your next step requires proactive investigation. We encourage plant managers to audit their current CIP frequency logs and daily SDI records. If you clean membranes more than once a month, your pretreatment is failing. Request a specialized feed water characterization study today. Secure this vital data before issuing an RFP for system upgrades, ensuring your facility remains efficient, compliant, and profitable for years to come.
A: Industry standard requires an SDI of less than 3.0 entering the RO membranes to minimize particulate fouling. Ideally, facility managers should aim for an SDI below 2.5 to ensure optimal membrane performance and longevity.
A: A well-designed system typically requires CIP every 3 to 6 months. Cleaning more frequently than once a month indicates a severe pretreatment failure. Frequent cleaning accelerates membrane degradation and increases operational costs.
A: No. While CIP can restore the majority of performance, irreversible fouling slowly degrades the membrane. This cumulative damage limits the RO element to an average 3-to-5-year operational lifespan before replacement becomes necessary.
A: Unlike suspended solids which can be easily filtered, bacteria only need a few surviving cells and organic nutrients to multiply. They rapidly create protective biofilms on the membrane surface that resist standard chemical cleaners and biocides.


